


Forecast Revenue From Your Pipeline and Flag At-Risk Deals
The Forecast tab in Opportunities gives us a clearer way to track pipeline performance, predict revenue, and catch deals that may be slipping before they are lost. Instead of relying on spreadsheets, we can use expected close dates and probability-based forecasting to understand what is likely to close, when it may happen, and where data gaps are hurting accuracy.
This is what turns pipeline tracking into actual revenue forecasting. And when forecasting is easier to trust, planning gets easier too.
What the Forecast tab helps us do
The Forecast tab is built to answer a few important questions quickly:
How healthy is our current pipeline?
What is the maximum revenue potential?
What revenue is expected based on deal probability?
How much revenue is already won?
Which open opportunities need attention?
Which deals are at risk of becoming lost?
Instead of piecing this together manually, the Forecast tab brings these signals into one place inside the selected pipeline.
Main Summary: a quick read on pipeline health
The first section to look at is the Main Summary. This gives us a high-level overview of pipeline health and performance.
It highlights four key metrics:
Max potential revenue, which shows the total upside in the selected pipeline
Expected revenue, which uses probability-based forecasting to estimate what is likely to close
Won revenue, which shows revenue already closed successfully
Open opportunities, which reflects how many deals are still active in the pipeline
These numbers work together. Max potential tells us the size of the opportunity set. Expected revenue gives us a more realistic forward-looking number. Won revenue shows what has already converted. And open opportunities reveal how much is still in motion.
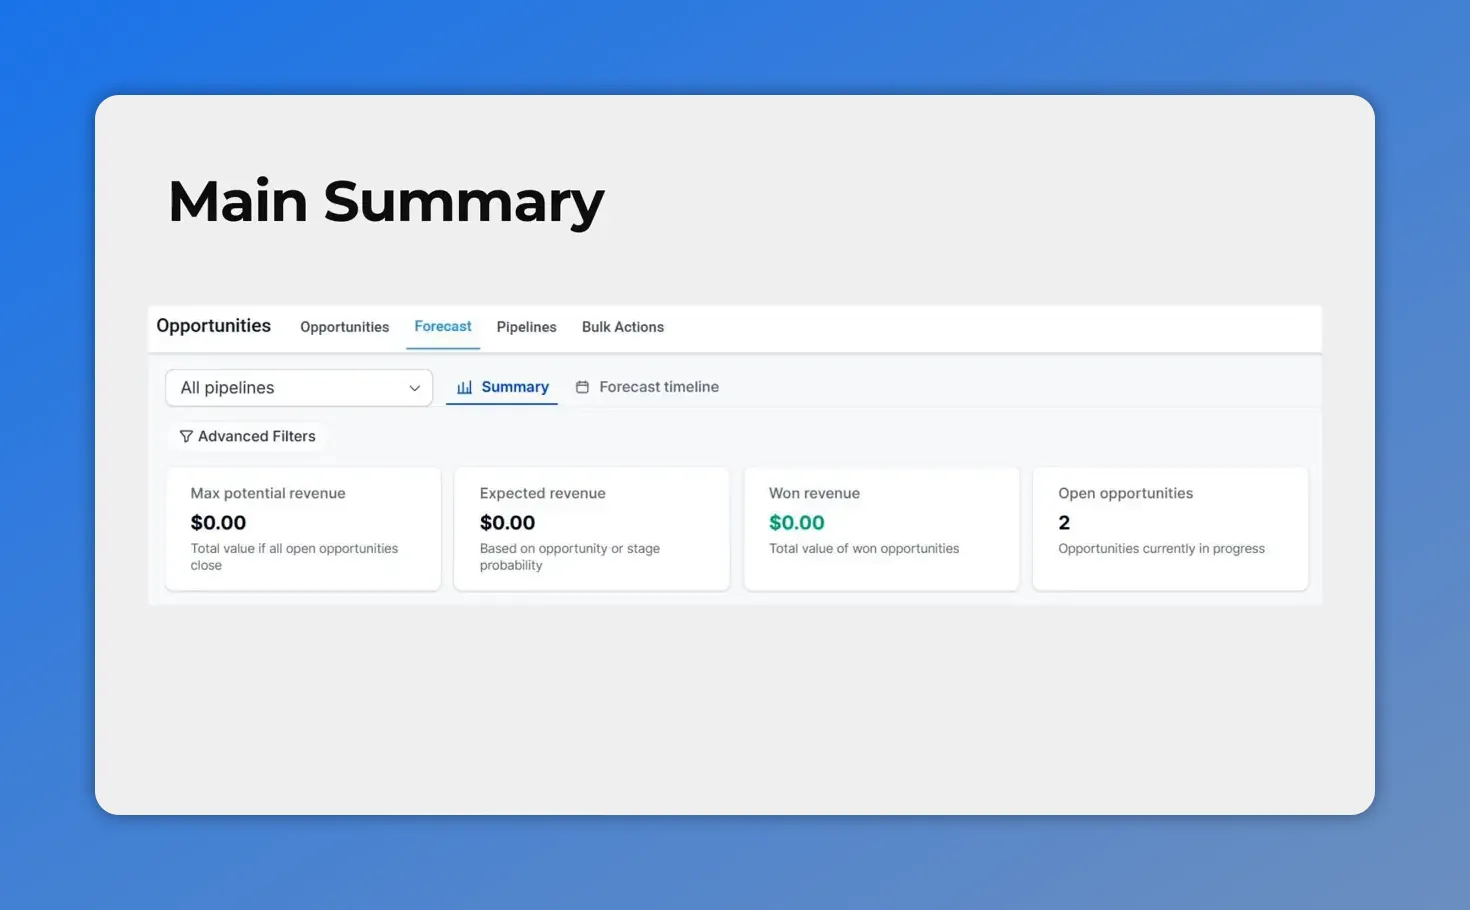
In the Main Summary, you get a quick, single-screen view of max potential revenue, expected revenue, won revenue, and the number of open opportunities—so pipeline health is easy to trust at a glance.
That combination is useful for both sales leaders and ops teams because it gives a fast read on current performance without digging through separate reports.
Fix Your Forecast Data: improve the quality of your forecast
Forecasting is only as good as the data behind it. If key information is missing, revenue projections become less reliable. That is why the Fix Your Forecast Data section matters.
This area surfaces actionable insights around missing information that is affecting forecasting. In plain terms, it helps us identify gaps that need to be cleaned up so the forecast reflects reality more closely.
That could include missing expected close dates or other opportunity details that influence how deals are projected over time. The purpose is simple: if the data is incomplete, the forecast will be incomplete too.
By working through this section regularly, we can:
Improve forecast accuracy
Build more trust in pipeline reports
Reduce surprises at the end of a period
Keep deal timelines current
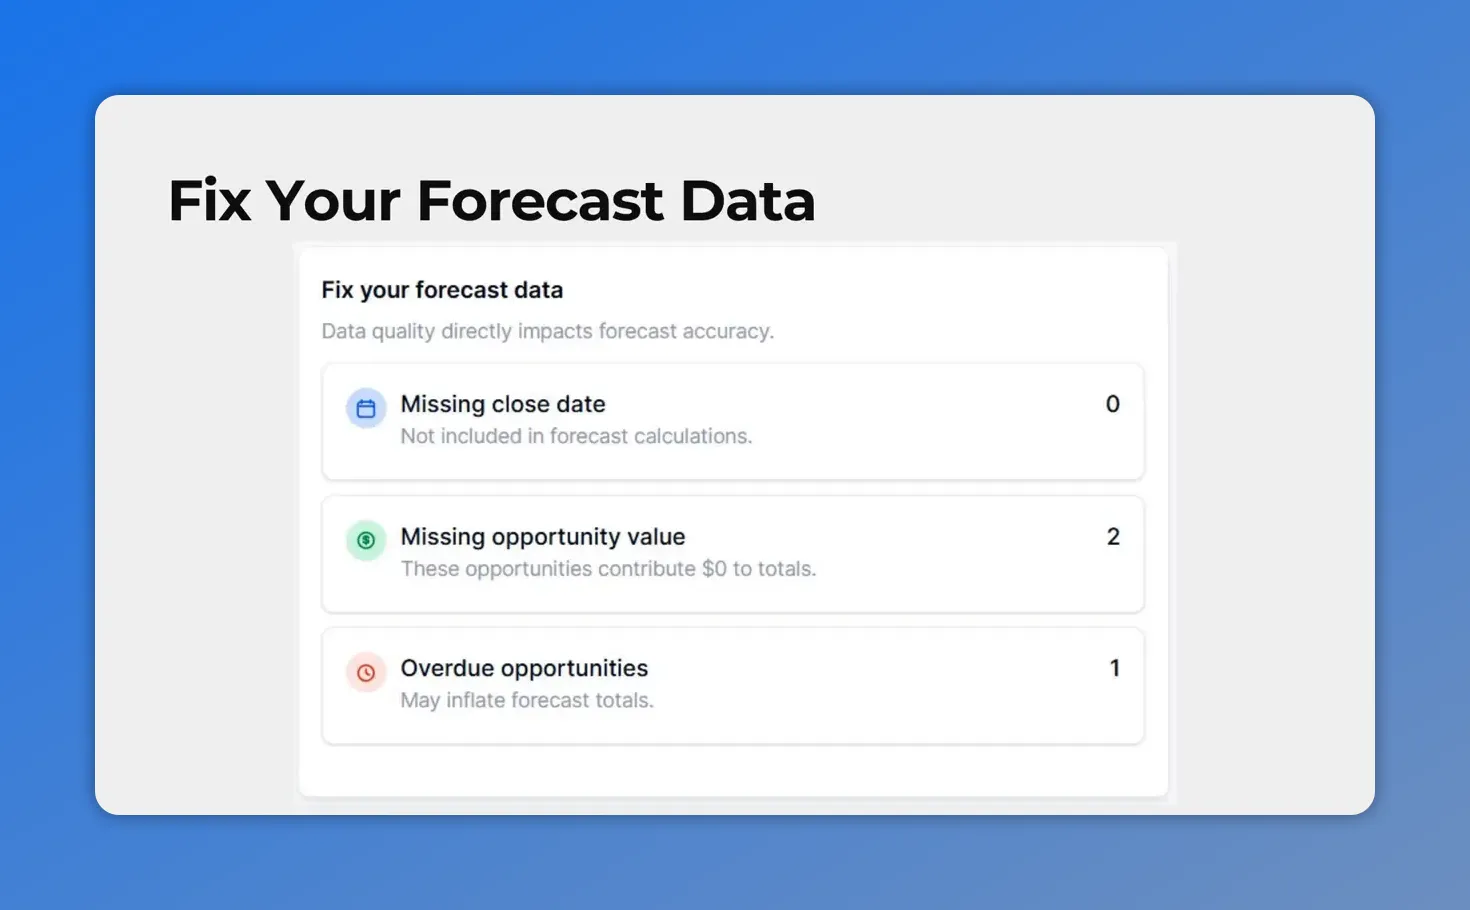
In the Fix Your Forecast Data section, the page highlights data issues like missing close dates, missing opportunity values, and overdue opportunities that can weaken forecast accuracy.
Forecast Timeline: see when revenue is likely to land
The Forecast Timeline helps us understand how opportunities are distributed across time. This is where the forecast becomes more operational.
Rather than only showing totals, the timeline shows how deals are spread across selectable periods in the chosen pipeline. That makes it easier to answer practical planning questions such as:
Are too many opportunities stacked into one period?
Do expected close dates look realistic?
When is revenue likely to arrive?
Where are future gaps forming in the pipeline?
This view is especially helpful when teams need to line up expected revenue with targets, staffing, or follow-up activity. It gives a time-based picture instead of a static one.
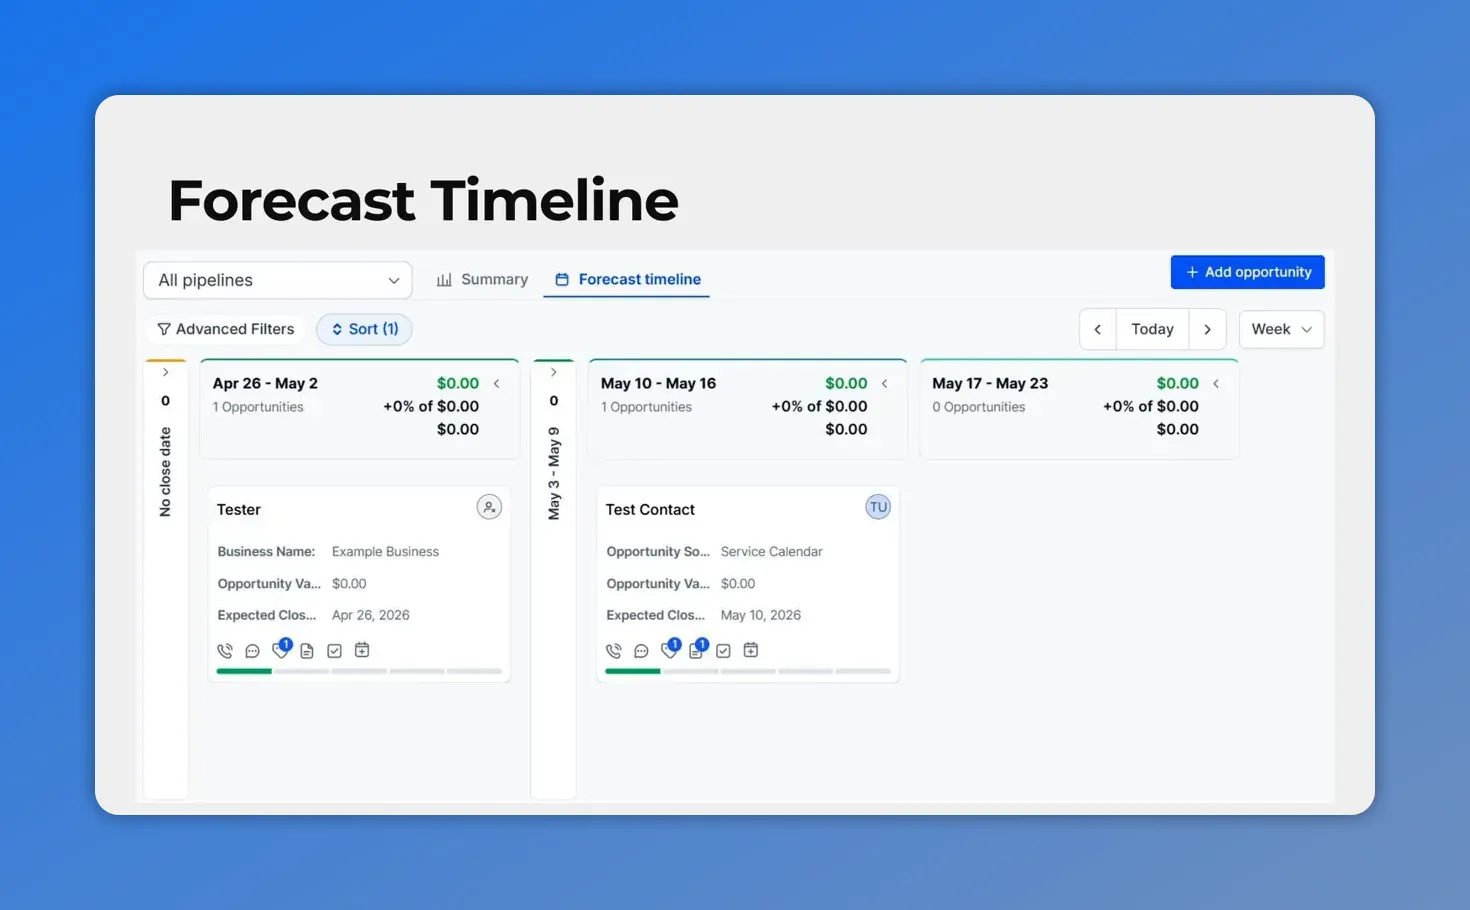
The Forecast Timeline view shows opportunities spread across time buckets so you can understand when revenue is likely to land (and spot where deals are clustering).
Use Group By for a deeper breakdown
Inside the Forecast Timeline, the Group by dropdown lets us change how opportunities are broken down in the chart.
We can organize the forecast based on:
Owner
Status
Expected close date
This matters because different questions need different views.
If we group by owner, we can see how pipeline and expected revenue are distributed across the team. If we group by status, we can understand where deals are sitting and whether too much pipeline is stuck early. And if we group by expected close date, we get a cleaner view of timing and revenue concentration.
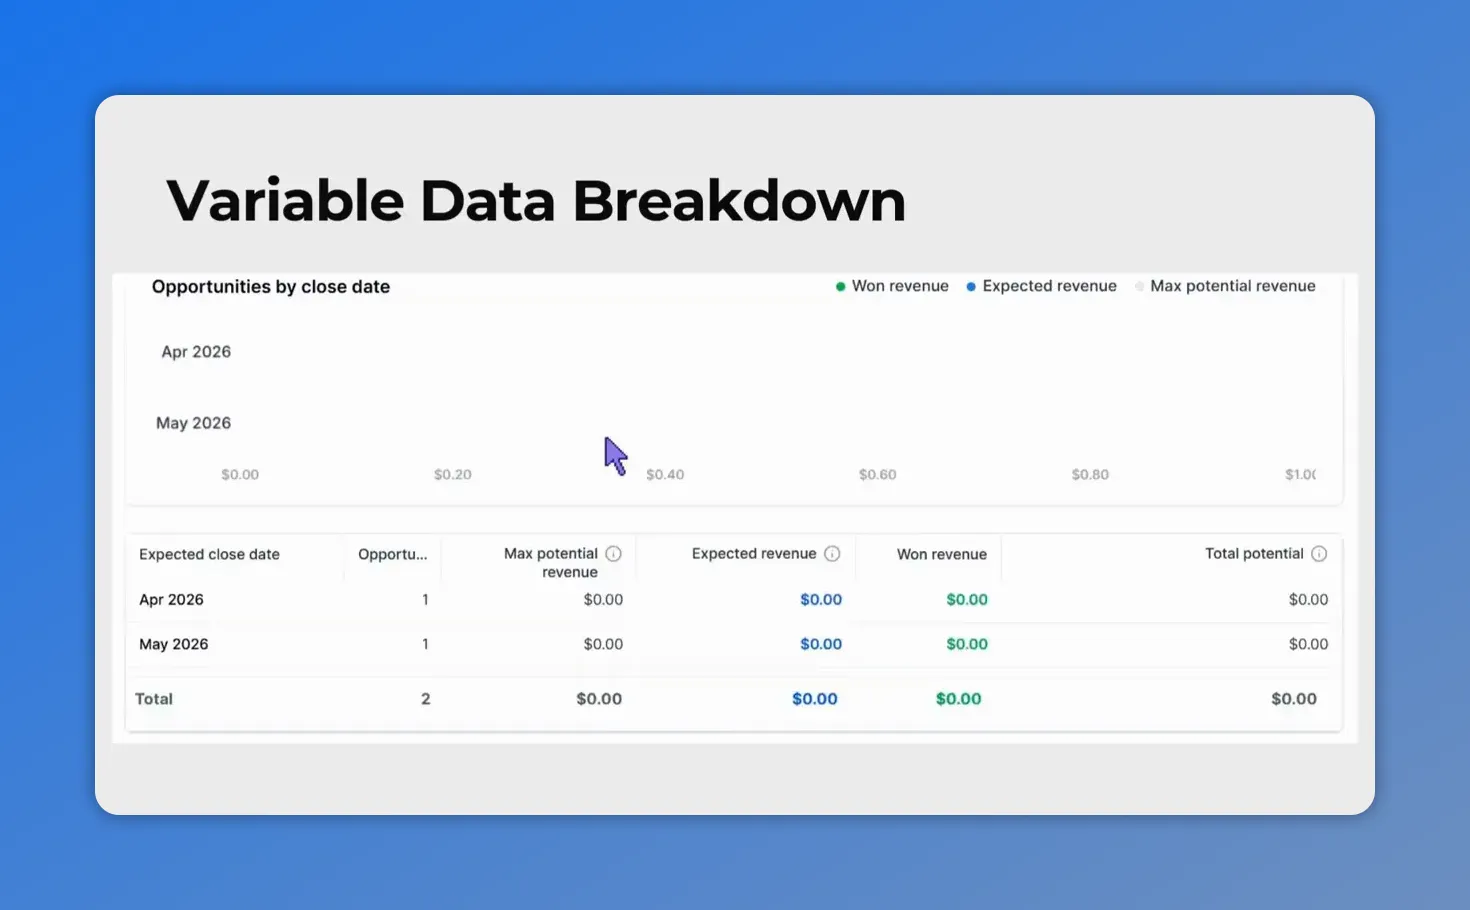
Grouping by close date gives a clearer timing view—helping you see expected and won revenue concentrated by month.
At-risk opportunities: spot slipping deals before they are lost
One of the most practical parts of the Forecast tab is the At Risk Opportunities section. This area is configurable, which means we can define what “at risk” means based on the way our team works.
The goal is to catch warning signs early. If a deal keeps getting pushed out or is sitting overdue, that is usually a sign that it may not close as expected. By flagging these patterns, we can focus attention where it counts.
This helps us move beyond a simple list of open deals and into a more realistic view of what is actually likely to close.
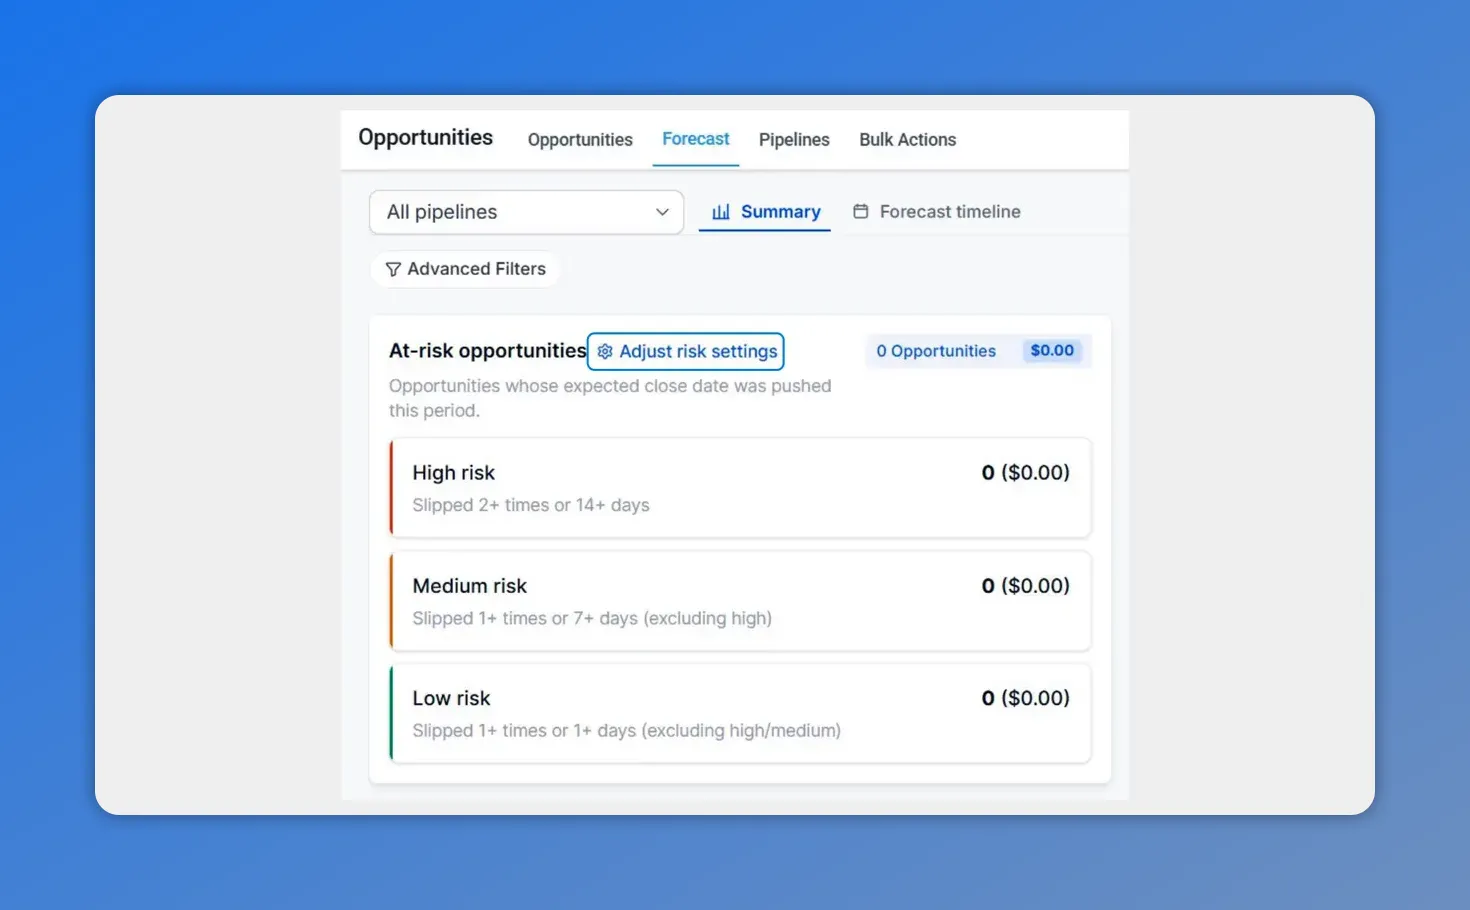
The At-risk opportunities panel shows how deals are bucketed into high, medium, and low risk, based on reschedules and overdue time.
How to adjust risk settings
Setting up at-risk opportunity rules is straightforward.
Scroll down to At Risk Opportunities.
Click Adjust risk settings.
Set how many times an opportunity must be rescheduled before it should be considered at risk.
Set how many days overdue an opportunity should be before it gets a risk label.
Choose whether those conditions are evaluated with OR logic or AND logic.
Click Apply.

This Adjust risk settings modal shows how you define at-risk rules using “times pushed” and “days past close date,” and lets you choose OR vs AND logic for each risk level.
OR vs AND: how the risk logic works
This setting controls how strict the risk rules are.
Choose OR if you want an opportunity to be marked at risk when either condition is met. For example, a deal could be flagged because it has been rescheduled too many times, or because it is overdue by too many days.
Choose AND if you want an opportunity to be marked at risk only when both conditions are true at the same time.
The right choice depends on how aggressively we want to surface warning signs. OR logic casts a wider net. AND logic is more selective.
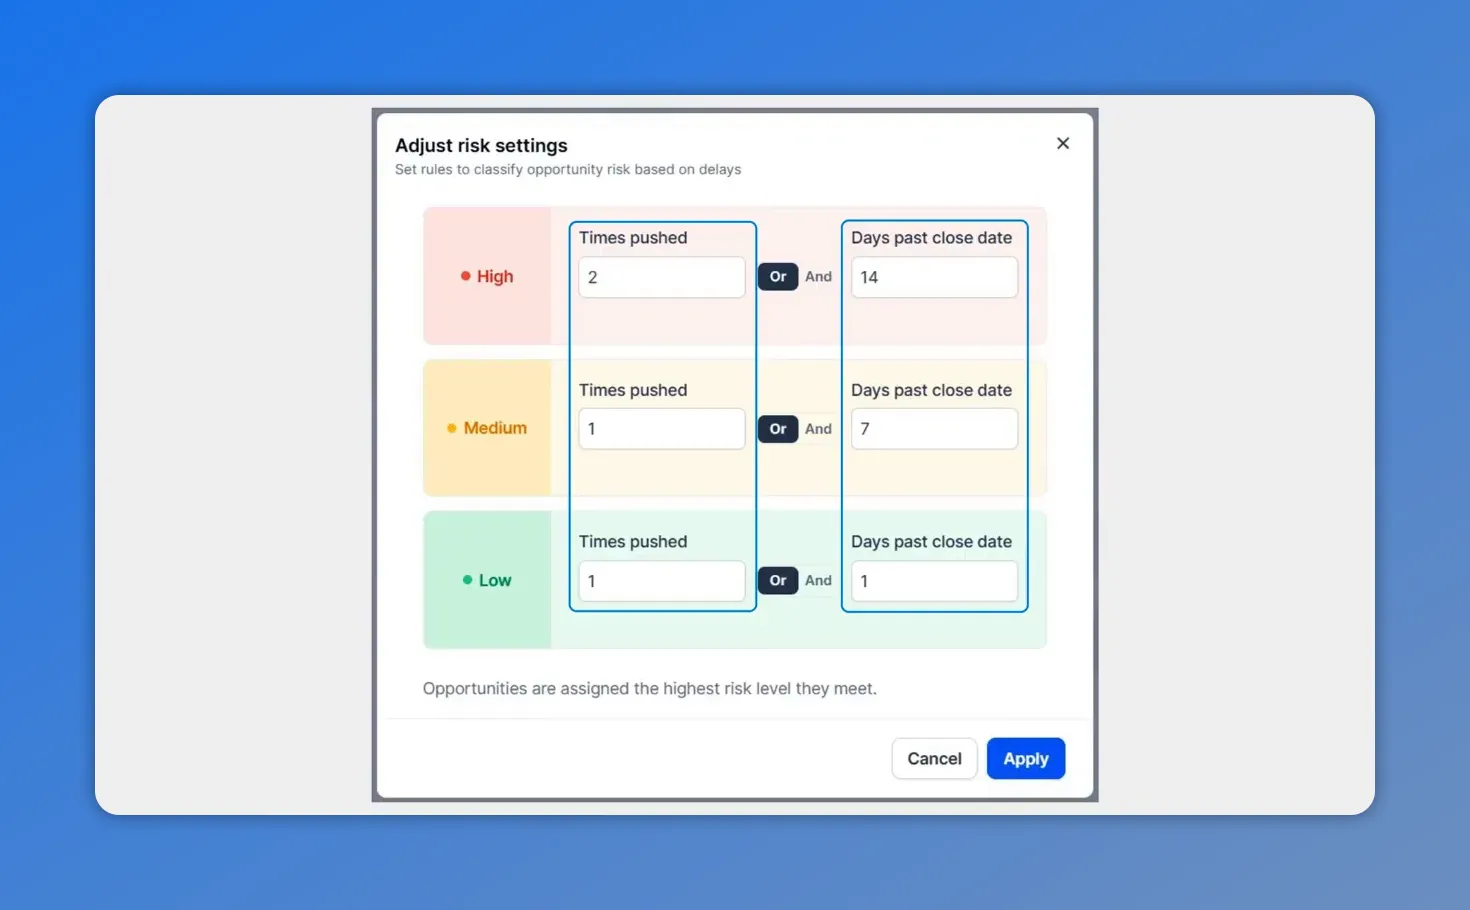
Here’s the risk logic you can configure for at-risk opportunities: set both “times pushed” and “days past close date,” and choose whether either condition (OR) or both conditions (AND) mark a deal as at risk.
Why this matters for sales forecasting
Good forecasting is not just about adding up open deals. It depends on timing, probability, data quality, and how quickly we can identify risk.
The Forecast tab supports that in four practical ways:
It improves visibility. We can see max potential, expected revenue, won revenue, and open opportunities in one place.
It improves data quality. Missing information that weakens the forecast is easier to catch and fix.
It improves timing. The Forecast Timeline helps us understand when revenue is expected to close.
It improves focus. At-risk rules help us identify slipping deals early so teams can take action before those opportunities are lost.
That is the shift from basic pipeline tracking to true revenue forecasting. We are not only asking what is in the pipeline. We are asking what is likely to close, when it should land, and which deals need intervention now.
A simple workflow for using the Forecast tab well
To get the most value from this feature, it helps to follow a consistent review process:
Start with the Main Summary to understand the overall state of the pipeline.
Review Fix Your Forecast Data to clean up missing fields that reduce forecast confidence.
Use the Forecast Timeline to examine when opportunities are expected to close.
Switch the Group by view to compare by owner, status, or close date.
Configure At Risk Opportunities so slipping deals are surfaced automatically.
That routine keeps the forecast grounded in current data and helps teams act sooner instead of reacting late.
FAQ
What does the Forecast tab show?
The Forecast tab shows a summary of pipeline health, including max potential revenue, expected revenue, won revenue, and open opportunities. It also includes data quality checks, a forecast timeline, and configurable at-risk deal tracking.
How is expected revenue different from max potential revenue?
Max potential revenue reflects the full upside of the selected pipeline. Expected revenue is a forecasted number based on probability, giving us a more realistic estimate of what may actually close.
What is the purpose of Fix Your Forecast Data?
This section helps identify missing information that affects forecast accuracy. It points us to the data gaps that need attention so our revenue projections are more reliable.
What can we group the Forecast Timeline by?
We can use the Group by menu to break down opportunities by owner, status, or expected close date.
How do at-risk opportunity settings work?
We define how many times a deal must be rescheduled and how many days overdue it can become before it is marked at risk. Then we choose whether those conditions apply with OR logic or AND logic and apply the settings.
Why use OR instead of AND in risk settings?
OR flags a deal when either risk condition is met, which makes the rule more sensitive. AND flags a deal only when both conditions are met, which makes the rule stricter.
Why is this useful for revenue forecasting?
It gives us a clearer picture of what will likely close and when, while also helping us catch weak data and slipping deals early. That leads to better planning and more confidence in the forecast.
This article was created from the video Forecast revenue from your pipeline and flag at-risk deals